

What are the results where you live of the U.S. County Health Rankings & Roadmaps that the Robert Wood Johnson Foundation published today? Here's a quick overview from AtlanticCities.com.
...a new report shows just how much variation in quality of life there is within each state, if you look at the most- and least-healthy counties. In Kentucky, for instance, the percentage of children living in poverty ranges from 8, in Oldham county near Louisville, to 57 percent in nearby Owlsey county, where the local farming and mining economies have dried up.
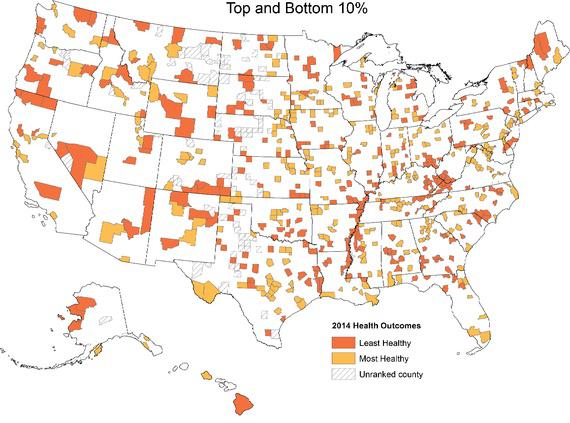
"The least healthy counties in the U.S. have twice the premature death rates (years of life lost before age 75), twice as many children living in poverty, and twice as many teen births compared to the healthiest counties," write the authors of a new ranking by the Robert Wood Johnson Foundation and the University of Wisconsin’s Population Health Institute.
The researchers also found that a number of non-medical factors, such as housing, transit, and college attendance, are associated with health behaviors and outcomes. Here's a look at how those elements break down by county:
College-educated people tend to live longer and healthier lives. The report defines “some college,” as the percentage of the population between the ages of 25 and 44 with some post-secondary education. From the map below, it's clear that this is particularly uncommon in the southern United States, but there's a huge range. In Texas, rates of "some college" vary from 25 to 80 percent among the counties.

http://www.theatlanticcities.com/politics/2014/03/most-and-least-healthy-counties-america/8726/


Comments (1)